
Find your place
Search a city or ZIP code, drop a map pin, or optionally use your device location. Refine approximate place centers and clear your location whenever you choose.
STORMTRAK / FREE EARLY ACCESS IS OPEN
Weather is a big picture.
StormTrak brings it closer to home.
Explore nearby storms, official warnings, local forecasts, and the new StormTrak Sky in one location-focused view.
Open now in your browser. No account or payment required.
 StormTrakINSIDE STORMTRAK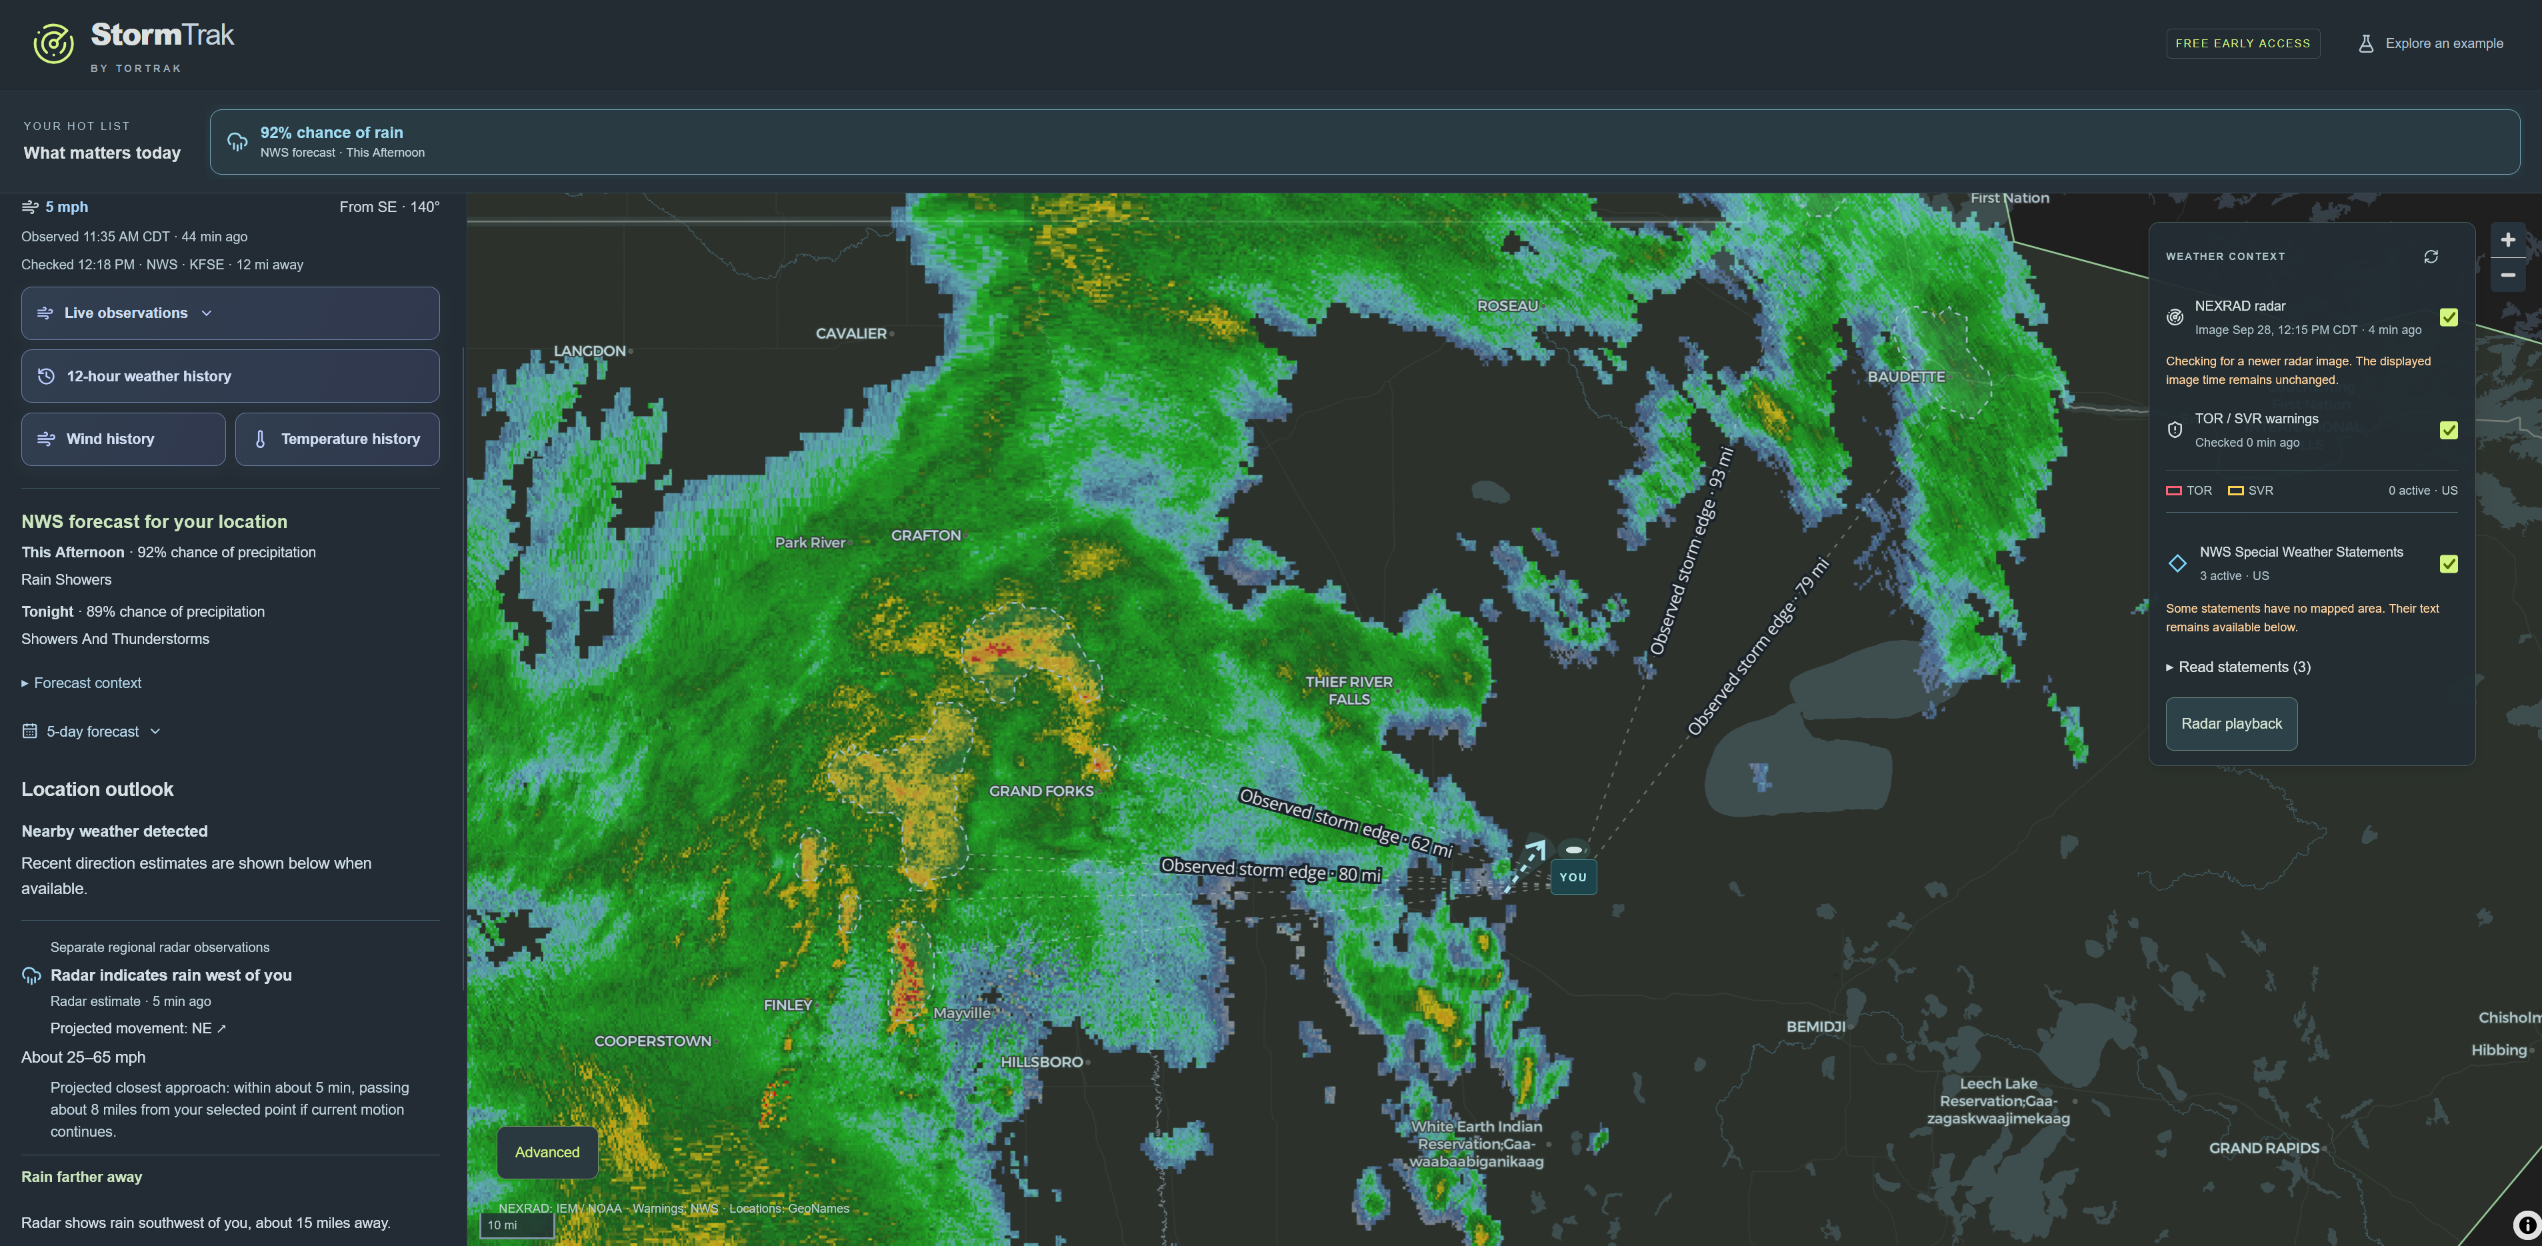
THE STORMTRAK SKY
Explore the new panoramic Sky: stars, constellations, moving clouds and changing light.
Animated demonstration, not live weather.
Daylight to starlight.
The atmosphere of StormTrak.
The app combines calculated celestial positions with an illustration of reported weather. This demo cycles through preset conditions. Sky sources & credits
01 / MEET STORMTRAK
Start with a place that matters to you. Explore 21 features, including the new panoramic Sky and recent workspace improvements, with clear sources and an honest view of uncertainty.
Search a city or ZIP code, drop a map pin, or optionally use your device location. Refine approximate place centers and clear your location whenever you choose.
Explore timestamped NEXRAD imagery, replay recent radar frames, and see observed storm outlines and distances on an interactive map.
Read NWS tornado and severe thunderstorm warnings, reported hazards, motion and full instructions. View Special Weather Statements, including text when no mapped area is available.
See supported movement estimates with compass directions, map arrows and approximate speeds or speed ranges. Direction, speed and movement toward your location are assessed separately.
See radar-indicated rain in your area, conditional projected arrival windows, or closest-approach time and distance when supported. Tracked storm cells also have their own projected-path assessment.
Check nearby station temperature, humidity, dew point, heat index, wind speed, gusts and wind direction when reported, with the station name, distance and observation time.
Explore 1-, 6-, 12- and 24-hour station history. Compare temperature with dew point and wind with reported gusts, inspect individual reports, and open the accessible data table.
Open day and night NWS forecasts for your selected location, including temperatures, precipitation chances, detailed conditions and forecast issue time.
Explore official severe-weather outlooks and tornado, hail and wind probability layers. See the outlook at your location with its issue time and valid period.
A location-focused briefing brings together active warnings, today’s severe and tornado outlook, and relevant forecast precipitation chances. Official warnings lead.
Browse nearby warnings, optionally listen to a warning read aloud, and inspect selected-storm severe, tornado, hail and wind probabilities, radar-estimated hail and lightning details when available.
Experimental tools assess downstream community centers or a map point using the selected storm’s projected path, arrival uncertainty and official warning context.
Choose storm outlines and projected paths, focus on a storm, and open deeper details in Advanced. Move supported panels, collapse the side panel, or hide the map menu to make room for radar.
See observation ages, delayed or unavailable data and clearly labeled historical direction context. Missing readings stay missing rather than becoming zero.
Try a clearly labeled simulated example, read first-use guidance and location/privacy information, and report a problem inside the app. Early access needs no account or payment.
A panoramic sky surrounds a foreground globe, with calculated Sun and Moon positions, stars, five planets, constellation patterns and a faint Milky Way.
See sunrise, sunset, moonrise and moonset in your selected location’s time zone, with the next event highlighted and clear explanations when an event does not occur.
Open Sky from the scene, its time strip or the Sun and Moon menu. Explore Moon phase details and a Sun/Moon altitude chart, with constellation, object-name and pause controls.
Layered clouds, fog, rain, snow and thunderstorm lighting illustrate reported conditions. Cloud cover and twilight affect celestial visibility; missing observations are kept distinct from clear skies.
Switch on animated wind particles from NOAA/NCEP GFS forecasts for wind near the ground. This modeled wind layer stays separate from station wind readings and a storm’s direction of travel.
Return to recent locations, forget saved places, and choose light or dark mode. Recent locations and display preferences are stored in your browser.
A CLOSER LOOK
Open the conditions panel to explore station reports and trends. These supplied screenshots show recorded weather; tap any image to view it at full size.
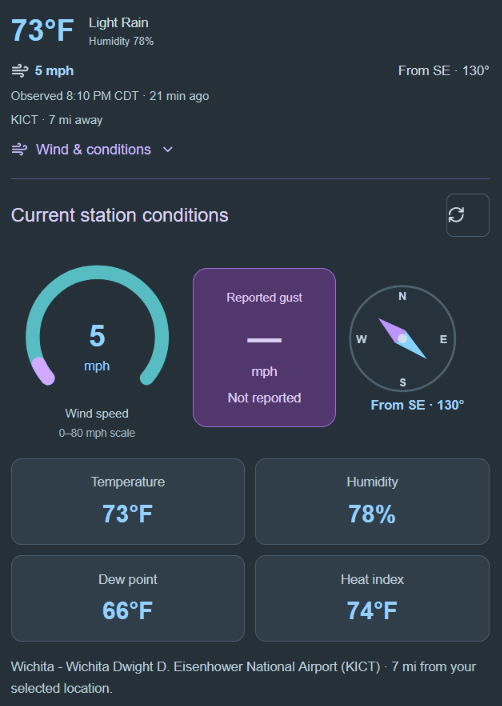
Station readings, wind direction and the age of the report, together in one view.
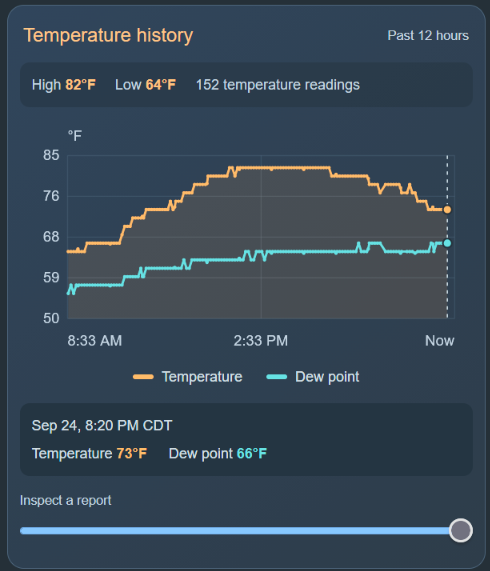
Compare temperature and dew point, explore highs and lows, and inspect individual observations.
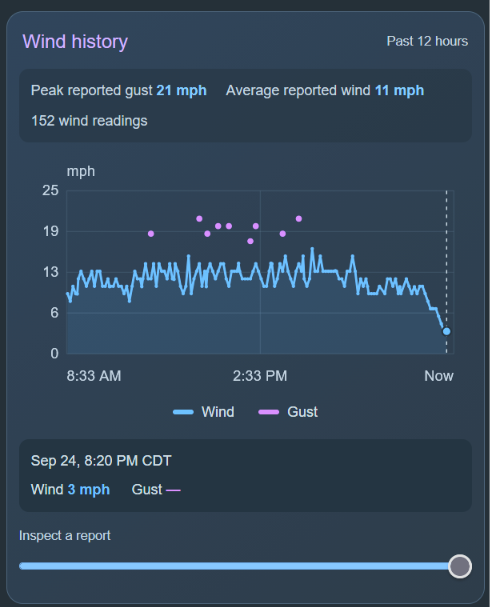
Follow reported wind and gusts over time. Missing gust reports remain clearly identified.
History windows in the current app end at the latest returned station report. Screenshots may show an earlier interface.
BEHIND THE DIRECTION ARROW
StormTrak combines several kinds of evidence while keeping their sources distinct. The wind at a nearby weather station is not the same thing as a storm’s travel speed.
NOAA’s Multi-Radar/Multi-Sensor (MRMS) observations show where precipitation is occurring. Masked cross-correlation looks for the same rain pattern in successive scans. Its displacement and the actual elapsed time provide a direction and speed estimate.
Recent local matches are compared with regional and neighboring motion. Reverse matching, pattern changes and agreement across observations help determine how much confidence to place in each result.
NOAA/CIMSS ProbSevere supplies storm objects and motion components. StormTrak checks consecutive observations for consistent identity, size, motion and position changes before using a cell’s projected path.
Spherical along-track and cross-track geometry relates that path to your selected location. A storm’s footprint and uncertainty matter, not just where its center is pointed.
NWS warnings and Special Weather Statements can report storm positions, direction and speed. StormTrak labels these as reported information, with the original source time, separately from its radar estimates.
Official warnings and instructions take priority. A nearby warning’s motion is not automatically assigned to a radar object simply because the two are close.
Direction, numeric speed, movement toward you and timing have separate evidence checks. That allows a useful broad direction even when a precise speed or arrival time is uncertain.
Supported radar footprints can produce conditional arrival windows or closest-approach estimates. Freshness, source age and location accuracy matter; storms can grow, split, merge or change course. Confidence labels are engineering assessments, not calibrated probabilities.
OPEN NOW. FREE DURING DEVELOPMENT.
Explore live radar, local conditions, official warnings and storm motion in your browser. Try StormTrak today and help shape what comes next.
Free early access is open at storm.tortrak.com.
Works on desktop and mobile browsers.

02 / TORTRAK’S DEATHSTAR
Tortrak’s DeathStar Tornado Tracker brings advanced radar, storm visualization, and production tools together for weather streams. It’s the broadcast and desktop side of the family.
Explore the full feature list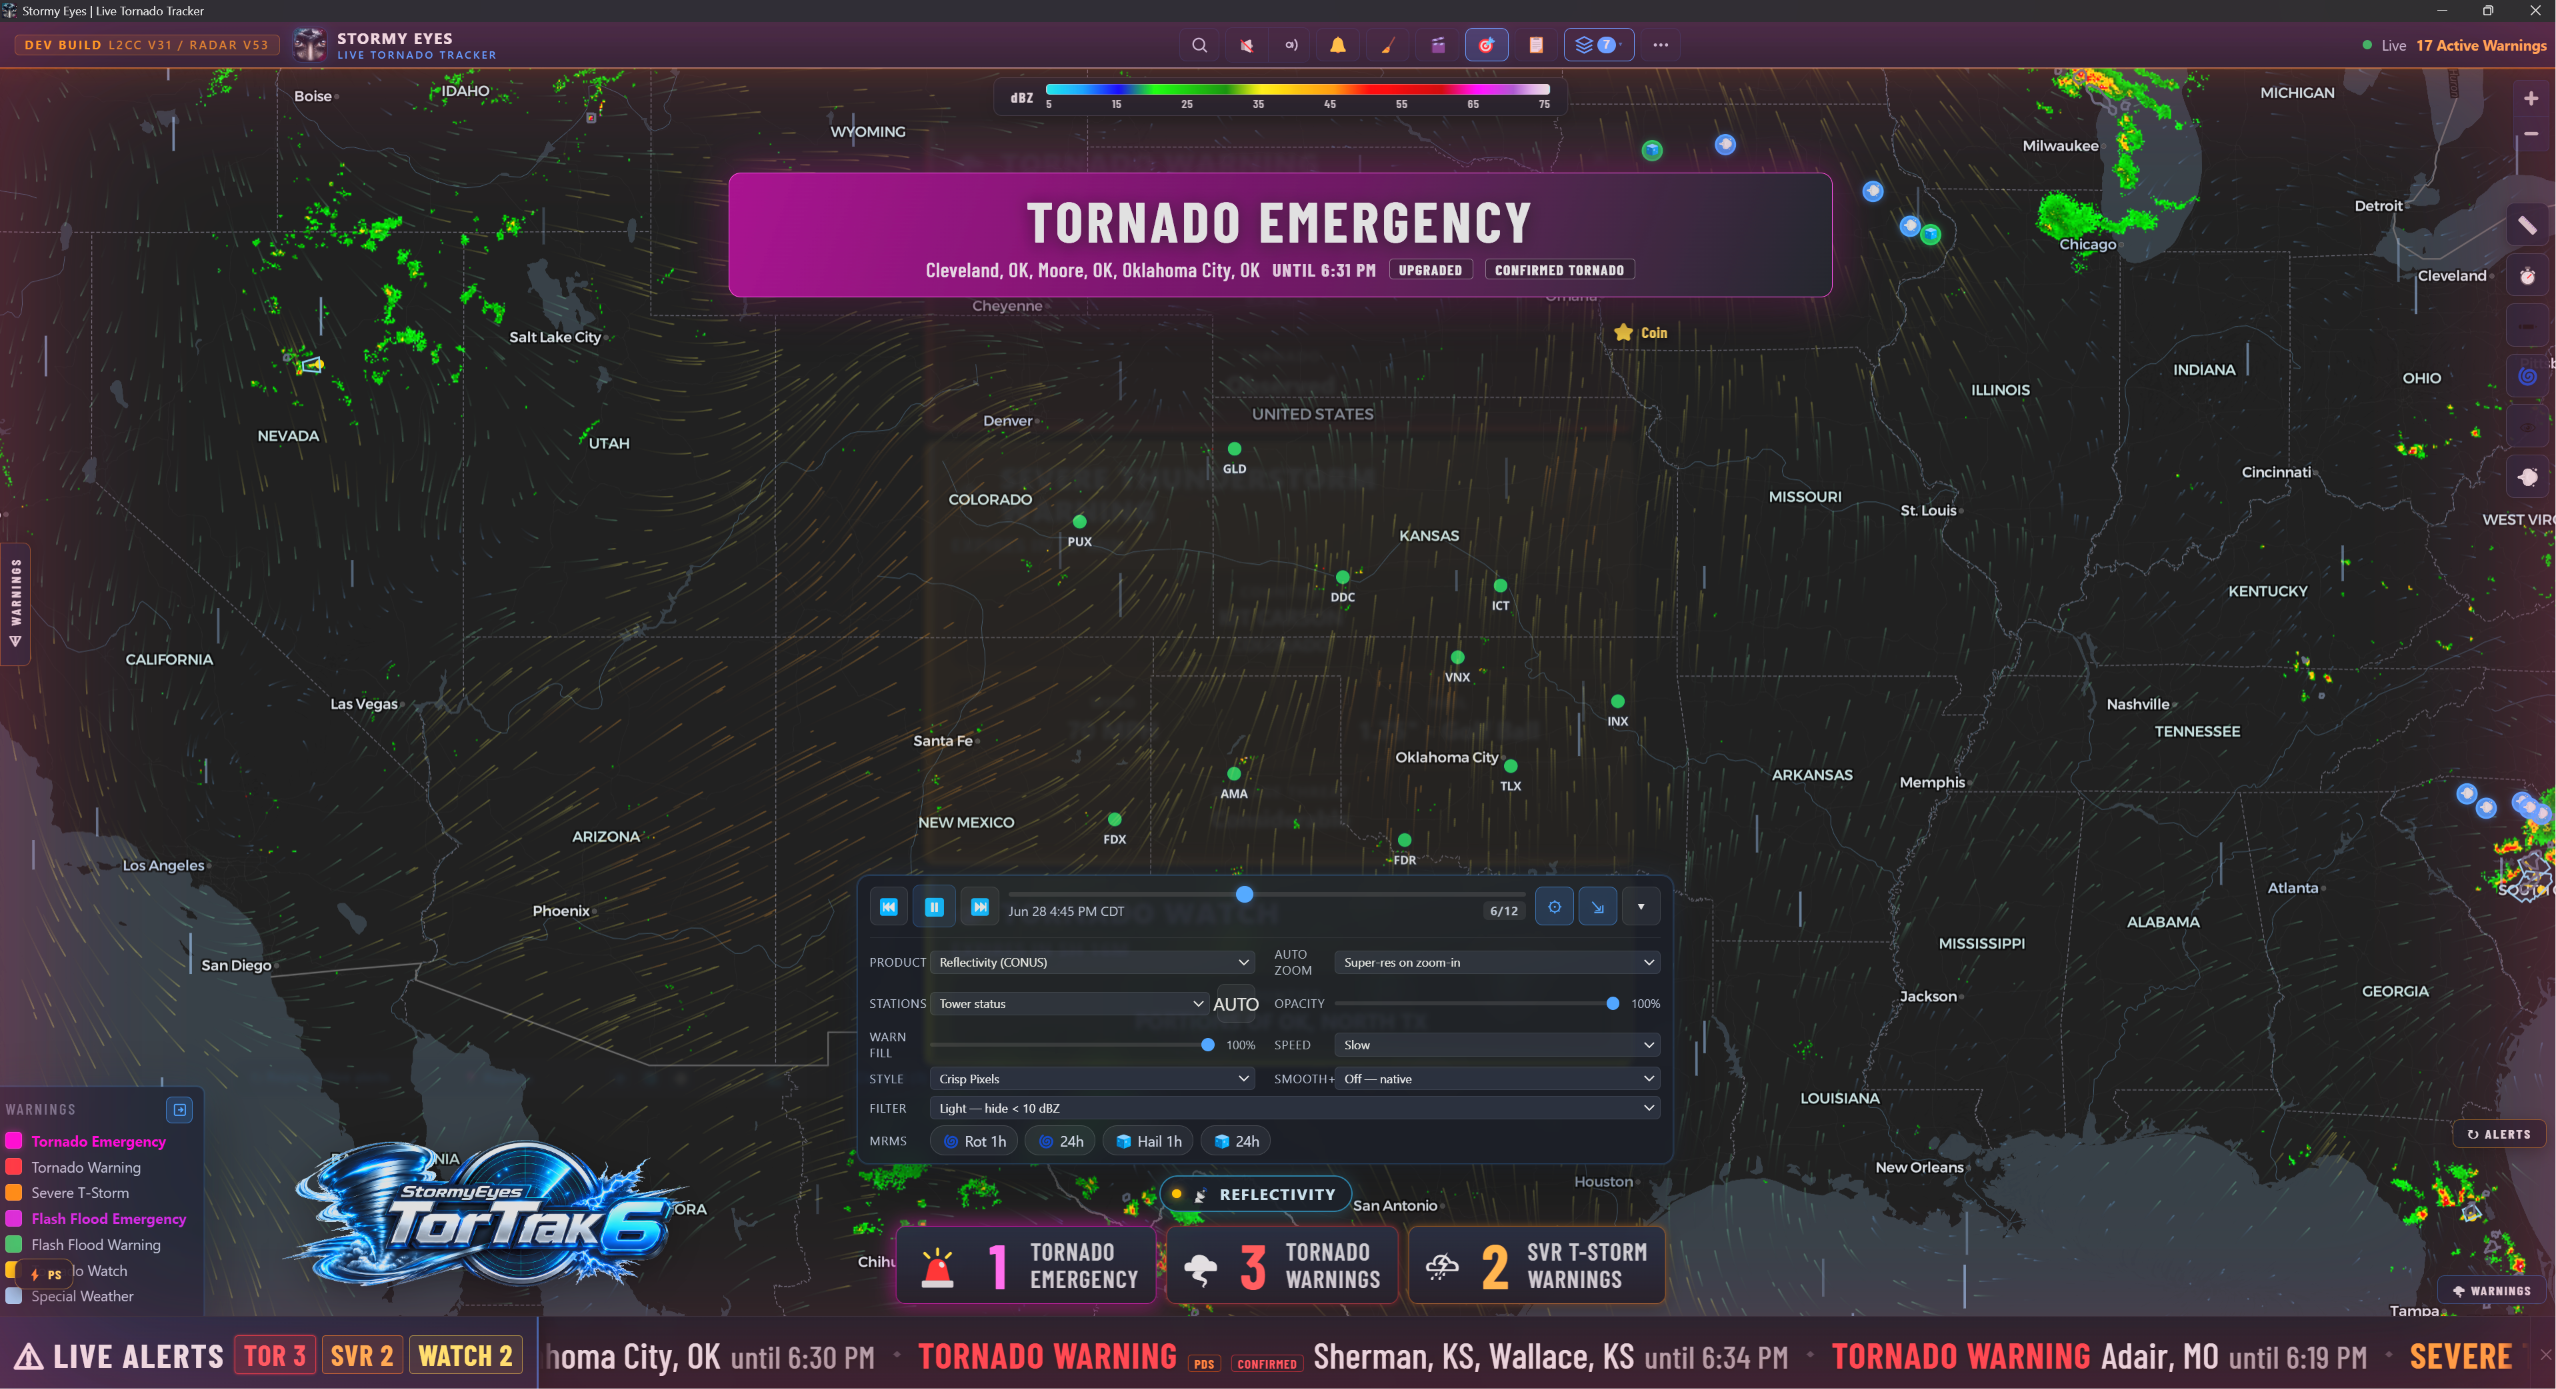
NEXRAD Level II, velocity, and dual-polarization products.
From point clouds to volumetric 3D visualization.
Camera automation, warning graphics, and OBS-ready views.
A browser workspace and a dedicated desktop experience.
Recorded platform demonstration with earlier Tortrak branding. Weather and warnings shown are examples, not current conditions.
03 / EXPLORE DEATHSTAR
Explore the DeathStar feature library by category. These are DeathStar’s broadcast and desktop capabilities; StormTrak’s early access features are described above.
Every reflectivity gate rendered as a point cloud — the fastest mode, and the best big-picture view of overall storm shape and where the cores are.
A single solid shell colored by height, from blue at the base up to red and white at the top — echo tops and overhangs read at a glance.
Three nested, see-through reflectivity shells. A hot core glowing inside a lighter outer shell marks the heaviest rain or hail buried in the storm.
Raw Doppler motion in 3D — green toward the radar, red away. Paired with Storm-Relative Motion, it's the primary rotation-hunting mode.
True volumetric rendering: the whole reflectivity field is ray-cast through the storm on the GPU for a smooth, glowing look. A drag-to-draw color curve — with GR2, Ramp, Core, and Hail presets — strips away the surrounding rain to expose a hook or hail core, live.
The same ray-marched rendering applied to Doppler velocity, using the familiar red/green inbound-outbound colors. Paint the curve asymmetrically to isolate just one side of a couplet, in full 3D.
DeathStar automatically hunts every volume for a stacked rotation signature and renders it as a glowing tube through the storm, colored by strength from base to top — visibly tightening and deepening as you loop through recent scans.
Dial in a storm's own motion and the 3D velocity views subtract it out, flattening the ambient wind field so a tight rotational couplet stands out on its own.
Step back through recent volumes in full 3D, in any mode, to watch a storm's structure evolve rather than looking at one freeze-frame.
Adjustable threshold, vertical exaggeration, and point size — all live, while rotating and panning the scene.
A beam-blockage layer that shades where mountains hide a radar's lowest scan is built and tested, and on its way back in after a final accuracy review.
Full-resolution, single-site data — not just the coarser national mosaic: base reflectivity, storm-relative velocity, and dual-polarization correlation coefficient, decoded straight from NOAA's real-time feed.
Correlation coefficient is a selectable product on its own, and CellTracker watches it automatically — a drop in CC coinciding with a rotation couplet flags a likely tornado debris signature: radar evidence a tornado is on the ground.
CONUS composite, single-site super-res reflectivity, storm-relative velocity, correlation coefficient, echo tops, GOES satellite, and HRRR forecast reflectivity — one control bar, each with a correctly scaled legend.
NCEP's HRRR model, hourly out to 18 hours on one model run — plain, or color-coded by precipitation type — clearly badged as a forecast so it's never confused with a live observation.
An optional classic "painting" radar renderer: a beam glides slowly around the scope revealing fresh data as it goes, the way a real WSR-88D scope looks.
Loop playback with adjustable speed and opacity, crisp-vs-smoothed rendering, a minimum-reflectivity noise gate, auto-follow-nearest-site or lock-to-site, and auto-dim under warning fills.
Blends your primary radar site with a second, user-picked site into one seamless composite — ideal for storms at the edge of one tower's range.
A synced 2×2 wall — composite, super-res reflectivity, velocity, and echo tops — sharing one camera, built for tornado-confirmation segments.
Click two points across a storm for an RHI-style vertical slice through every tilt — hook echoes and hail cores aloft, on a flat chart.
Hover anywhere on the velocity field for the exact Doppler wind speed and direction under the cursor, read from the real decoded value.
Extreme Doppler velocities automatically unfold so they display correctly instead of wrapping to the wrong color.
Every radar site's status — live, stale, or down — is monitored continuously, with automatic failover to the nearest producing tower and an honest on-screen badge.
Nearby high-threat radar sites are quietly pre-loaded in the background, so switching to them on air is instant.
Behind the scenes, new Level II data is pushed the moment it lands rather than waiting on the next poll.
A purpose-built map style tuned for radar contrast and on-stream legibility.
Persistent storm-cell tracking: every cell keeps a stable ID and a rotation tier that survives scan to scan, so you're watching one storm's evolution, not a new blob every volume.
Between radar scans, a cell's marker now glides along its own measured motion instead of freezing in place — and snaps back the instant fresh data lands.
Draws each warned storm's motion vector and pulse rings, tracked forward between official updates so the marker never lags a fast-moving storm.
A single, constantly-updating nationwide severe-weather score, charted over the last 12 hours — weighted so a long tail of flood warnings can't outweigh an actual tornado outbreak.
Click a warning and DeathStar projects the storm's next two hours and lists every town in its path with distance and estimated arrival time.
Draw your own box anywhere on the map for an instant severe-weather probability read on that specific area.
Live tornado, severe thunderstorm, flash flood, and related warnings straight from the National Weather Service, with full text, timing, and tags like PDS and Tornado Emergency.
The interface changes color with the highest warning level in view: clear, watch, severe, tornado, confirmed tornado, and tornado emergency. A consistent visual language carries through to floating analytics panels.
An ambient particle layer that changes with the threat level — calm on a quiet day, rain for severe storms, wind-blown debris for a tornado warning — with eight selectable calm-day looks, from snow to fireflies to falling leaves.
Text-to-speech announcements for new and updated warnings, with a priority queue, change detection, and an optional natural-sounding neural voice.
A running, reviewable log of everything the voice engine has said, and when.
Distinct alert tones layered alongside or instead of the spoken voice alerts.
Transient, color-coded cards announcing new warnings visually, whether or not sound is on.
A bottom-of-screen crawl cycling through every active warning and watch, color-coded, with live alert counts.
A full-width animated banner that takes over the screen the moment a high-impact warning is issued or upgraded.
A subtle edge-of-screen glow that shifts with the worst warning nationwide.
A sticky card that always shows whatever storm the AI camera is currently on.
Optionally fly the map to every new tornado warning or emergency, automatically.
Official Tornado and Severe Thunderstorm Watch boxes, plus the SPC's own probability breakdown for each — chance of tornadoes, damaging wind, and large hail.
A hands-free camera with three modes — off, tornado-only, or tornado+severe — that cuts to new warnings, tours the active ones, and settles back to a national view when it's quiet. Grab the map and it hands control right back.
A step up: an AI camera that continuously scores every storm in the country and stays locked onto the single most dangerous one, only cutting away once another storm clearly overtakes it.
Red Flag Warnings, Fire Weather Watches, and Fire Warnings on the map, in their own amber/brown palette so they never read as storm products.
Day 1 and Day 2 categorical fire risk — Elevated, Critical, Extremely Critical — plus dry-thunderstorm risk areas.
Named, active wildfires with acreage and percent-contained, plus their mapped perimeters, from the National Interagency Fire Center.
NASA satellite-detected heat sources, updating continuously once enabled.
Every fire layer is clickable — incident name, acreage, containment, hotspot intensity, and detection time, all in one card.
Fire activity never inflates the warning count, moves the National Threat Index, or triggers the on-air chrome — it runs quietly alongside tornado coverage without competing for attention.
Active tropical system positions, forecast cone, forecast track, and wind radii straight from the National Hurricane Center.
Real-time strike data, aged and faded by how recently each strike happened.
NOAA's rotation-track and maximum-hail-size products, switchable between 1-hour and 24-hour windows — a tornado's path paints in as it happens.
Per-storm, model-driven probabilities of tornado, hail, and wind risk, with a full breakdown on click.
GOES true-color and infrared imagery layered under the radar.
Near-real-time utility outage territories, useful for correlating storm damage with what's actually losing power.
Day 1 categorical and probabilistic severe outlooks, plus SPC's own mesoscale discussions.
Hourly CAPE, shear, helicity, and composite-parameter fields for any region, auto-refreshing.
An animated, windy.com-style layer showing the current surface wind field across the country.
Same-day tornado, wind, and hail reports, plus a running chart of today's hail sizes.
Right-click anywhere for a forecast sounding and computed severe-weather indices at that exact spot.
A searchable browser of decades of historical tornado tracks, filterable by year and EF-scale rating.
Significant historical tornado tracks fade in automatically near an active warning — instant "this is paralleling that year's storm" context.
A time machine for any past date: archived radar re-animated in sync with how the warnings actually evolved, clearly badged so it's never mistaken for live.
One-click recap video generation — drives Replay through a chosen window and records a fully composited broadcast frame straight to a downloadable video.
A distance ruler, plus a tool that reads a storm's real motion and computes closing speed and arrival time at any point you click.
TV-meteorologist-style annotation — pen, arrows, circles, and text — glued to the geography as you pan and zoom.
Right-click anywhere for exact coordinates, to save a named location, or to jump to the nearest radar sites.
Fast city, state, or ZIP lookup to fly anywhere in the country.
One click, one answer, even where several layers overlap.
A portrait 9:16 layout for TikTok Live and Shorts-style vertical capture, with the interface automatically rearranging to fit.
Every major layer and setting is controllable by URL, so a pinned streaming bookmark always looks the same — plus a full hotkey set and a clean mode that strips all chrome down to a pure map for a browser-source overlay.
A one-click broadcast rehearsal that fires the ticker, banners, and toasts with realistic fake data, so the whole on-air look can be tested with zero actual weather happening.
A floating, draggable, resizable logo overlay.
Key panels detach, float, resize, and collapse independently, remembering position between sessions — and one key clears every open popup and tool at once.
Defaults to Central and UTC, expandable to every U.S. time zone — handy when a national audience is watching a storm in someone else's time.
A simple access-code lock on the hosted web version, so it isn't casually indexed or shared.
The same features as the web version, running as its own window with a taskbar icon and a one-click installer.
Covering the window entirely with capture software never pauses the radar loop, ticker, or particle effects — a common browser limitation this eliminates outright.
Stops Windows from suspending the app mid-stream.
No URL at all — nothing hosted, indexed, or shareable the way a web address can be.
Remembers window size and position across restarts, so relaunching mid-stream reopens exactly the shape your capture software expects.
A FEW THINGS TO KNOW
StormTrak is a location-focused weather tool for exploring nearby storms, official warnings, and projected motion. Tortrak’s DeathStar Tornado Tracker is the advanced broadcast and desktop platform, with 3D radar, camera automation, and on-air production tools. This website introduces both.
Free early access is open now. Open StormTrak in your browser. No account or payment is required.
Yes. StormTrak’s current early access features will be free during development. Future plans and additional capabilities may follow; there are no subscriptions or payments on this site.
Storm paths cover the contiguous United States. The warning view includes NWS tornado and severe thunderstorm warnings, with Special Weather Statements available separately. It does not include every type of weather alert.
No. StormTrak is an experimental weather exploration tool, not an emergency alert service, and it does not send push alerts. Projections assume continued motion; storms can change quickly. Follow official NWS instructions and keep another way to receive warnings.
First-party session analytics is on by default for requests matched to the US by a local, approximate country lookup. Outside-US and unknown-country requests remain aggregate-only, without session timelines or analytics identifiers. It records fixed page labels and deliberate feature actions in order, using random temporary analytics identifiers shared between tortrak.com and storm.tortrak.com. They are separate from login cookies and do not identify verified people. Server-observed IP addresses may be linked to these sessions; an address can be shared by unrelated visitors. Approximate country/region and ISP or network information may be looked up locally, without sending visitor IPs to an external resolver. Detailed events, identifiers, IP links and enrichment caches expire within 14 days and are excluded from our automatic backups. No searched city, ZIP, address, coordinates, device/saved location, map center, form or feedback content, full URL, query string, fragment, credential or raw cookie/header is recorded in analytics. The owner can compare IP and time with separate security evidence to investigate abuse; matching addresses do not prove one person. Security protection remains active when optional analytics is off. Turning analytics off stops new collection and removes the dedicated analytics cookie; previously collected detail remains subject to the 14-day limit. The shared on/off preference applies to both sites; older host-specific opt-outs are also respected. We voluntarily suppress optional first-party metrics when GPC or DNT is present. GPC primarily covers sale/share or targeted advertising; this broader suppression is our policy. These metrics are not sold or used for targeted advertising. Browser support for DNT varies; the existing usage control remains available. Analytics failures never prevent weather use. Existing non-IP aggregate totals remain: hourly summaries expire after seven days and daily summaries after 400 days; aggregate backups within seven more days. There is no third-party analytics script.
Global Privacy Control and Do Not Track are respected. This preference uses a shared on/off cookie for both Tortrak sites, separate from the temporary analytics identifier. With JavaScript disabled, browser privacy signals still apply.